2020 Year in Review: The impact of COVID-19 in 12 charts
12 charts provide an overview of our research in the face of a truly unprecedented crisis.
- 16 December 2020
- 5 min read
- by World Bank
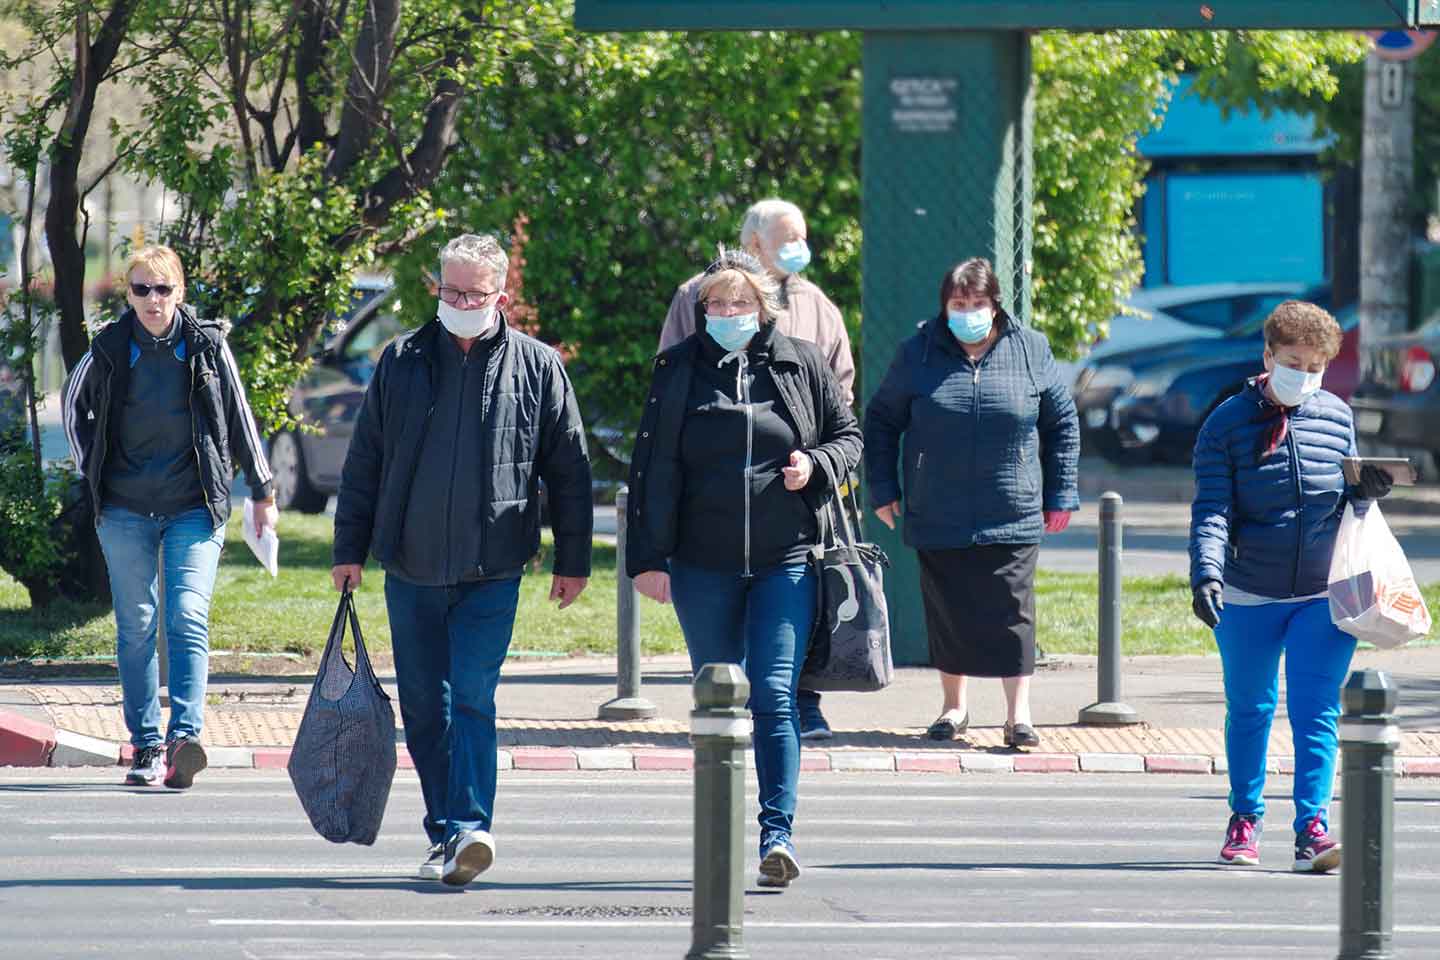
This time last year, concepts such as “lockdowns,” “mask mandates” and “social distancing” were unknown to most of us. Today they are part of our everyday language as the COVID-19 pandemic continues to impact all aspects of our lives. Through the following 12 charts and graphics, we try to quantify and provide an overview of our colleagues’ research in the face of a truly unprecedented crisis.
The New Poor
Over the past 12 months, the pandemic has harmed the poor and vulnerable the most, and it is threatening to push millions more into poverty. This year, after decades of steady progress in reducing the number of people living on less than $1.90/day, COVID-19 will usher in the first reversal in the fight against extreme poverty in a generation.
Due to the COVID-19 pandemic, extreme poverty is likely to increase sharply
Number of people in extreme poverty
Sources: Lakner et al. (2020) (updated), PovcalNet, Global Economic Prospects
Note: Extreme poverty is measured as the number of people living on less than $1.90 per day. 2017 is the latest year with official global poverty estimates. SAR regional estimates are not shown.
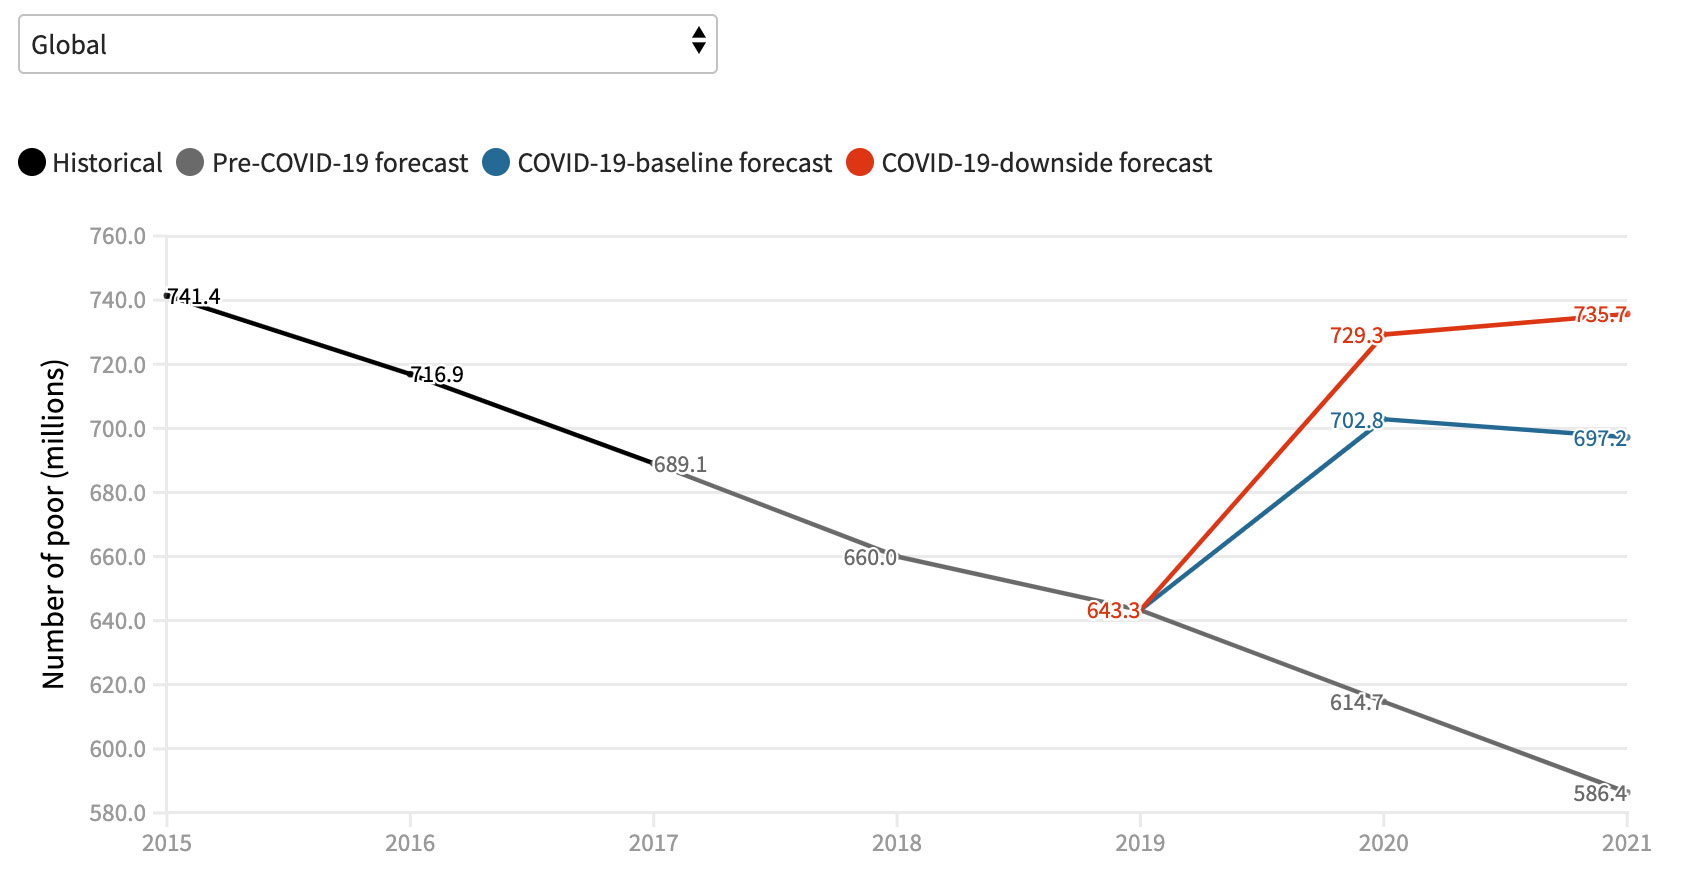
The latest analysis warns that COVID-19 has pushed an additional 88 million people into extreme poverty this year – and that figure is just a baseline. In a worst-case scenario, the figure could be as high as 115 million. The World Bank Group forecasts that the largest share of the “new poor” will be in South Asia, with Sub-Saharan Africa close behind. According to the latest Poverty and Shared Prosperity report, “many of the new poor are likely to be engaged in informal services, construction, and manufacturing – the sectors in which economic activity is most affected by lockdowns and other mobility restrictions.”
Accelerated Economic Downturn
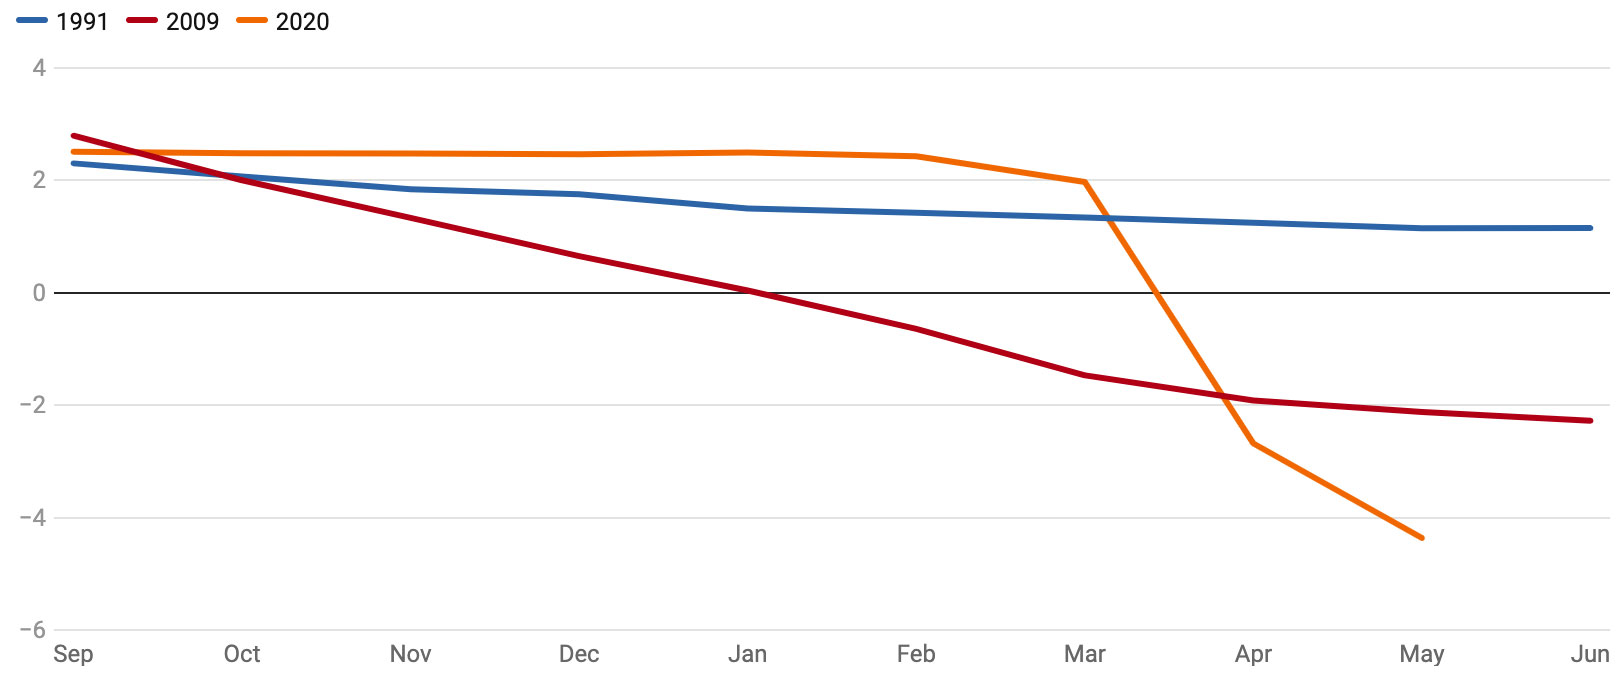
Those restrictions – enacted to control the spread of the virus, and thus alleviate pressure on strained and vulnerable health systems – have had an enormous impact on economic growth. The June edition of the Global Economic Prospects, put it plainly: “COVID-19 has triggered a global crisis like no other – a global health crisis that, in addition to an enormous human toll, is leading to the deepest global recession since the Second World War.” It forecast that the global economy as well as per capita incomes would shrink this year – pushing millions into extreme poverty.
The COVID-19 recession has seen the fastest, steepest downgrades in consensus growth projections among all global recessions since 1990
Consensus forecasts of global GDP (percent)
September to December shows forecasts made in the previous year, while January to June shows data for the current year. Data for 1991 are for advanced economies only due to data availability.
Source: Consensus Economics, World Bank
Relieving the Debt Burden
This economic fallout is hampering countries’ ability to respond effectively to the pandemic’s health and economic effects. Even before the spread of COVID-19, almost half of all low-income countries were already in debt distress or at a high risk of it, leaving them with little fiscal room to help the poor and vulnerable who were hit hardest.
For this reason, in April, the World Bank and IMF called for the suspension of debt-service payments for the poorest countries to allow them to focus resources on fighting the pandemic. The Debt Service Suspension Initiative (DSSI) has enabled these countries to free-up billions of dollars for their COVID-19 response. Yet, as the graph below illustrates, debt service outlays to bilateral creditors will impose a heavy burden for years to come, and quick action to reduce debt will be needed to avoid another lost decade.
Debt service to official bilateral creditors will impose a heavy burden for years to come
The animation below shows the shifting composition of annual debt-service obligations that low-income countries owe to their bilateral creditors-from 2020 through 2022. It reflects projected debt service payments on external debt to official bilateral creditors (TDS, current US$, millions).
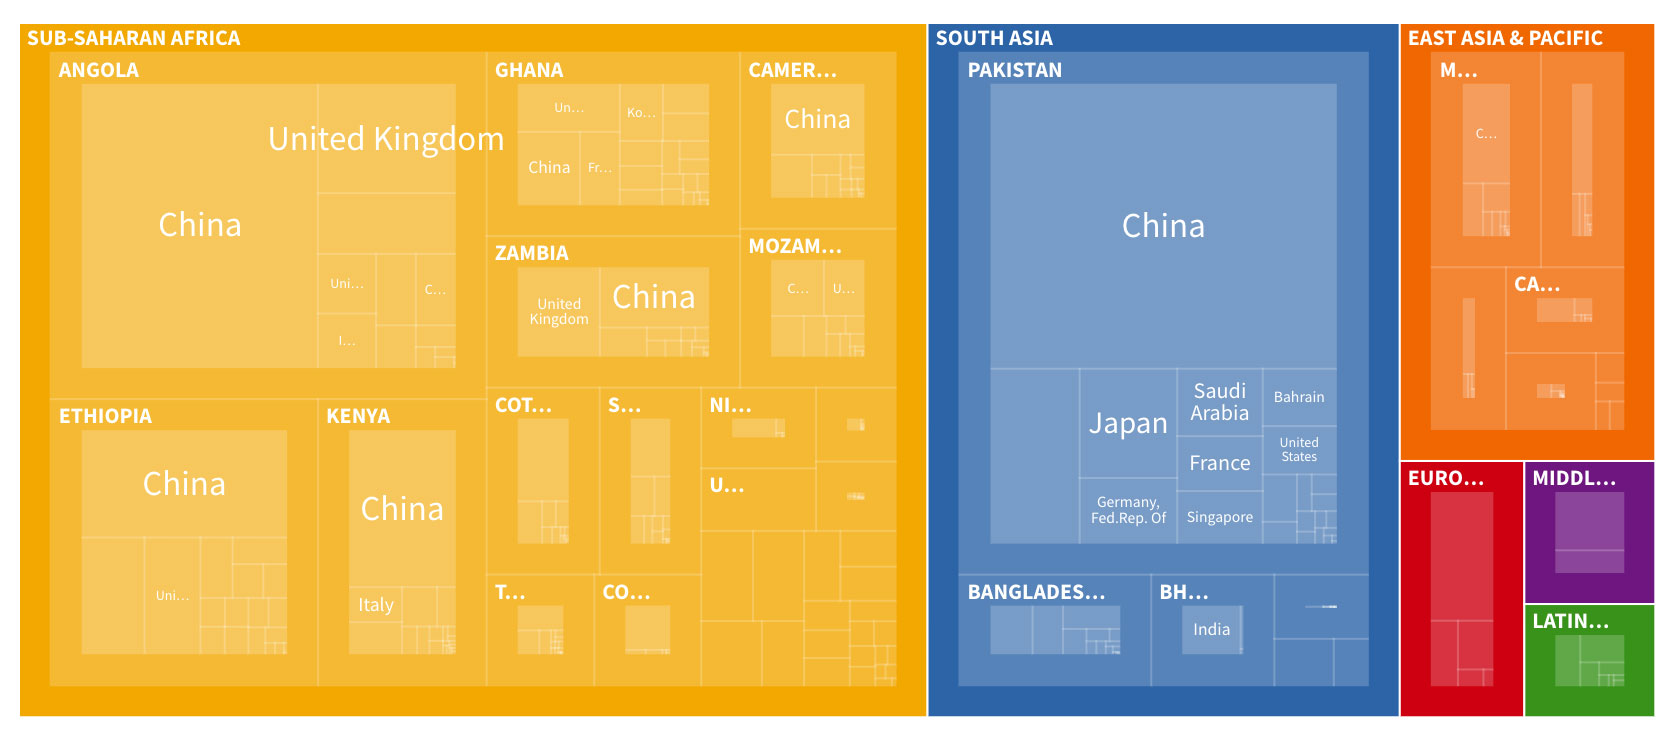
As World Bank Group President David Malpass has said, “Debt service suspension is an important stopgap, but it is not enough.” He added that “many more steps are needed on debt relief,” including an expansion of DSSI while a more permanent solution can be developed.
Without more action on debt, a sustainable recovery could be stunted in many countries – along with a host of other development goals. As Global Economic Prospects noted, while many emerging markets and developing economies (EMDEs) were able to implement large-scale fiscal and monetary responses during the 2007-2008 Financial Crisis, today they are less prepared to weather a global downturn. The most vulnerable of them rely heavily on global trade, tourism, and remittances. The next edition of Global Economic Prospects, including updated forecasts, is due in early January.
Migrants Sending Less Money Home
Remittances – the money that migrants send to their home countries – are of special concern. Over previous decades, remittances have played an increasingly important role in alleviating poverty and sustaining growth. Just last year, these flows were on par with foreign direct investment and official development assistance (government-to-government aid).
But COVID-19 has spurred a dramatic reversal, with our latest forecasts finding that remittances will decline 14% by the end of 2021 – a slightly improved outlook compared with the earliest estimates during the pandemic, that should not belie the fact that these are historic declines. All regions can expect a drop, with Europe and Central Asia seeing the steepest fall. Associated with these declines, the number of international migrants is likely to fall in 2020 – for the first time in modern history – as new migration has slowed and return migration has increased.
To continue reading please click here.
PARTNER CONTENT
This article was first published by The World Bank Group on 14 December 2020
AUTHORS
Paul Blake
External Affairs Officer, World Bank
Divyanshi Wadhwa
Junior Data Scientist
Sara Haddad, Paul McClure, Jasmin Buttar, Bassam Sebti, Srimathi Sridhar and Christine Montgomery contributed to this project.
More from World Bank