Forgotten pandemic: The cholera emergency in five charts
Global statistics for 2023 show an increase in cases and deaths as the cholera pandemic rolls on.
- 13 September 2024
- 3 min read
- by Linda Geddes
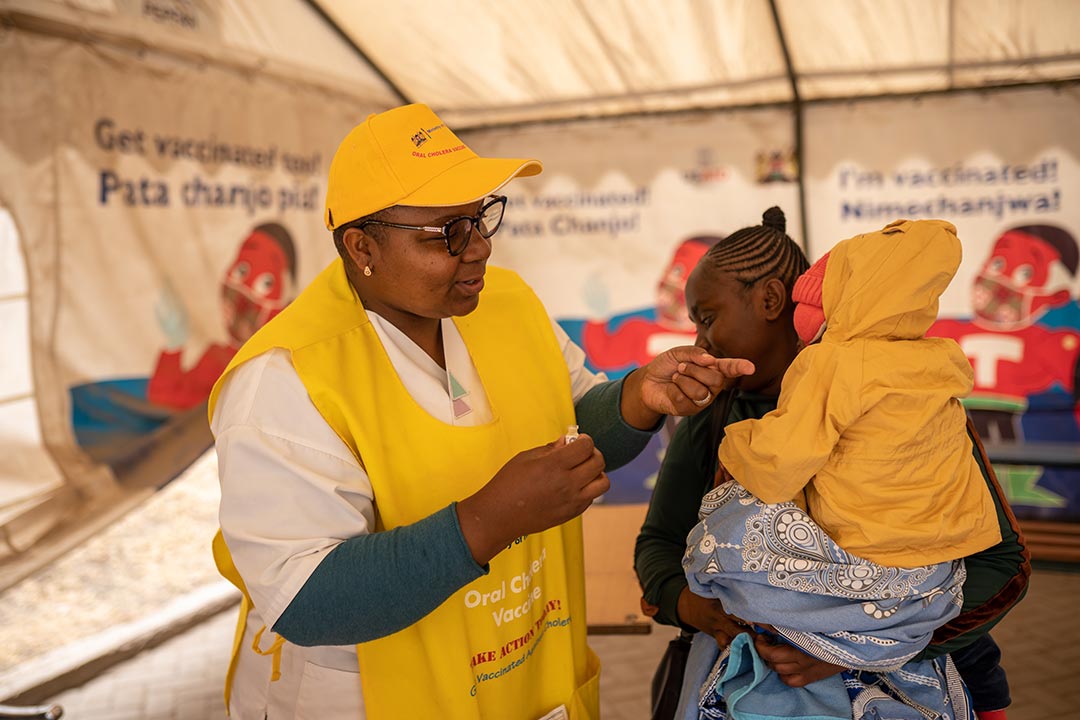
More than 4,000 people died from cholera during 2023 – an increase of 71% on the previous year – according to the latest World Health Organization (WHO) statistics. The current cholera pandemic (the seventh in recorded history), started in south Asia in 1961, with the disease subsequently spreading to other continents and becoming endemic in many countries. However, conflict, climate change and inadequate safe water and sanitation have contributed to a surge in cholera cases and deaths in recent years.
Here’s our visual guide to the state of cholera in the world today, and progress towards tackling it:
1. Cholera cases and deaths continue to increase
Cholera is an acute diarrhoeal disease that can kill within hours if left untreated, but it can be prevented through the provision of clean water, basic sanitation and hygiene, and it is easily treated using oral rehydration solution, or intravenous fluids and antibiotics in severe cases. Conflict, climate change, limited investment in development and population displacement have contributed to a recent increase in the number of cholera outbreaks, with 535,321 cholera cases reported to WHO during 2023 – a 13% increase from 2022. Reported deaths from cholera increased by 71% during the same period.
 |
2. More countries are reporting outbreaks
Forty-five countries reported cholera cases during 2023, ten of which involved imported cases – those where someone contracted the disease during travel to an area where cholera is endemic.
The number of countries reporting cholera was higher than the 44 reporting cases during 2022, and the 35 countries reporting cholera in 2021.
 |
3. The geographical distribution of cases has changed
2023 saw a shift in the geographical distribution of cholera, with a 32% decrease in cases reported from the Middle East and Asia, and a 125% increase in Africa.
Cholera has persisted in Africa partly because of worsening sanitation and socioeconomic conditions, poor and unreliable water supplies, and population migration to urban areas. Extreme weather events in Eastern and Southern Africa have exacerbated the situation, by limiting access to safe water and sanitation, straining health systems and triggering population displacement – including the spread of cholera across borders.
Have you read?
Many countries in Africa also reported a high proportion of community deaths – those occurring outside health facilities – indicating serious gaps in access to cholera treatment.
 |
4. Nine countries reported very large and disruptive cholera outbreaks
Not only did the number of countries affected by cholera increase, so did the number experiencing very large outbreaks – those involving more than 10,000 suspected or confirmed cholera cases. Such outbreaks were reported across nine countries – Afghanistan, Bangladesh, the Democratic Republic of the Congo (DRC), Ethiopia, Haiti, Malawi, Mozambique, Somalia and Zimbabwe – two more than in 2022, and more than double the number of very large outbreaks reported annually between 2019 and 2021.
Four of these countries – Ethiopia, Haiti, Mozambique and Zimbabwe – did not report very large outbreaks in 2022.
 |
5. Vaccine shipments
Although supplies of oral cholera vaccine remain strained, given the number of outbreaks requiring vaccination response, a record 35 million doses were shipped to 12 different countries during 2023 to help combat outbreaks and save lives. A new simplified vaccine, Euvichol-S, is expected to be on the global market by the end of 2024, which will help to increase the global stockpile of vaccines for emergency response.
Important as vaccination is, safe drinking water, sanitation and hygiene remain the only long-term and sustainable solutions to ending the cholera pandemic.
 |
