2011–2015 indicators
2011–2015 indicators
We achieved or surpassed our three mission goals for the 2011–2015 period
Check the indicators below to see how we performed against our mission and strategic goals. For a more detailed analysis of our progress in the period, download the 2015 Annual Progress Report (APR) below.
MISSION INDICATORS
In the 2011–2015 period we used three indicators, each with specific targets, to measure progress against our mission: to save children's lives and protect people's health by increasing access to immunisation in poor countries.
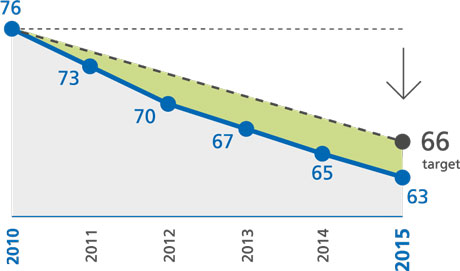
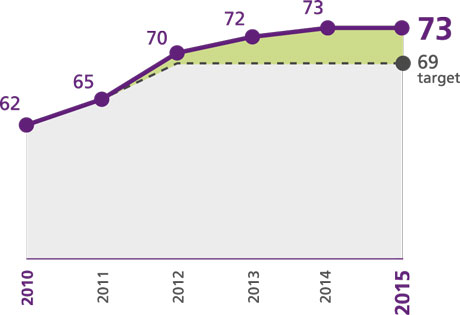
Under-five mortality rate (per 1,000 live births)
The under-five mortality indicator measured the probability of a child born in a Gavi-supported country dying before reaching the age of five.
Data sources
Mortality estimates from the Inter Agency Group for Child Mortality Estimation. Estimates were weighted using population estimates from the United Nations Population Division, Department of Economic and Social Affairs, World Population Prospects for the 73 Gavi-eligible countries (as of 2010).
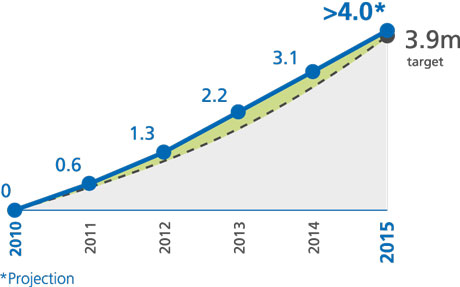
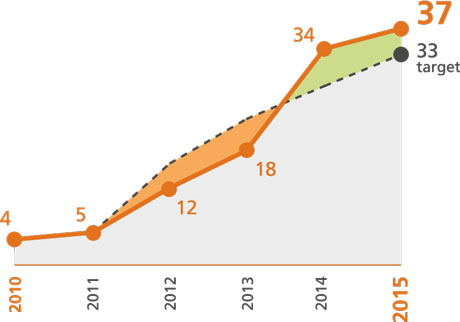
Number of future deaths averted (millions)
This indicator assessed our contribution to averting future deaths through pentavalent, pneumococcal, rotavirus, yellow fever, meningitis A, Japanese encephalitis, human papillomavirus, typhoid and rubella vaccination in 73 Gavi-eligible countries.
Data sources
Joint impact modelling by Gavi and the Bill & Melinda Gates Foundation.
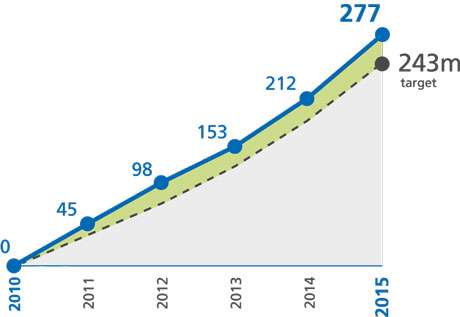
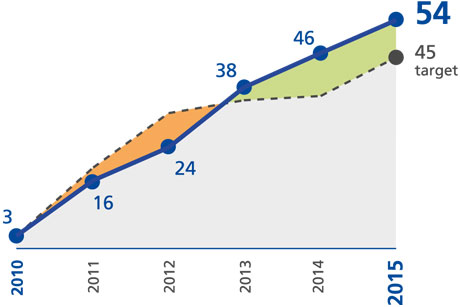
Number of children immunised (millions)
This indicator measured the number of children who received Gavi-funded vaccines through routine immunisation. To ensure that we did not double-count children who received multiple vaccines, we calculated the total number of children reached with the last recommended dose of any Gavi-supported vaccine.
Data sources
WHO/UNICEF Estimates of National Immunization Coverage, United Nations Population Division; World Population Prospects.
VACCINE GOAL INDICATORS
Two sets of indicators measured progress against our 2011-2015 vaccine goal to accelerate the uptake and use of new and underused vaccines.
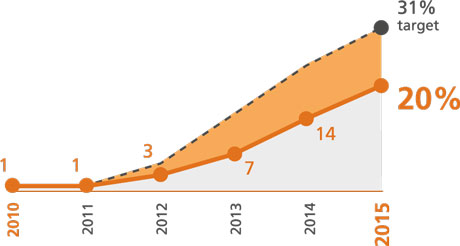
Number of country introductions
Data sources
Strategic Demand Forecast. Progress: Gavi, the Vaccine Alliance.
PENTAVALENT
ROTAVIRUS
PNEUMOCOCCAL
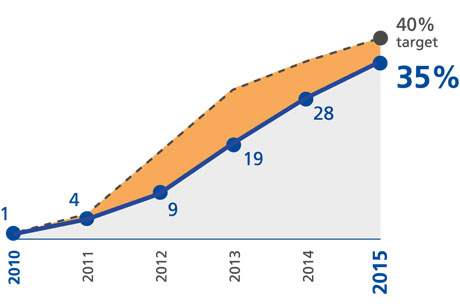
Coverage (%)
Data source
Targets: Strategic Demand Forecast. Progress: population weighted coverage estimates from WHO/UNICEF.
PENTAVALENT
ROTAVIRUS
PNEUMOCOCCAL
HEALTH SYSTEMS GOAL INDICATORS
We used three indicators to measure progress towards achieving our second strategic goal: strengthening the capacity of integrated health systems to deliver immunisation.
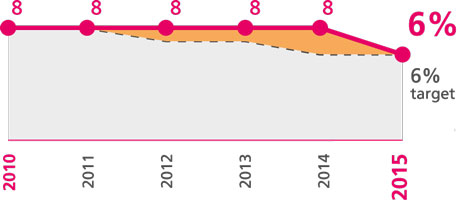
Percentage point difference between DTP1 and DTP3
This indicator measured the difference between the coverage of one dose of diphtheria-tetanus-pertussis vaccine (DTP1) and three doses (DTP3) of the same vaccine in 73 Gavi-eligible countries. This difference, the “drop-out rate”, is used as a standard measure of the strength of a health and immunisation system, demonstrating its potential to reach children with the third dose in a series.
Data sources
Targets: based on the assumption that Gavi’s investments in health and immunisation systems strengthening could support countries to decrease their drop-out rate by approximately half a percentage point per year. Progress: WHO/UNICEF coverage estimates.
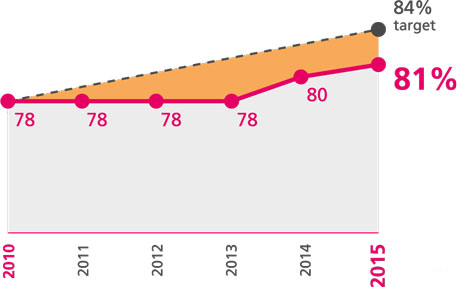
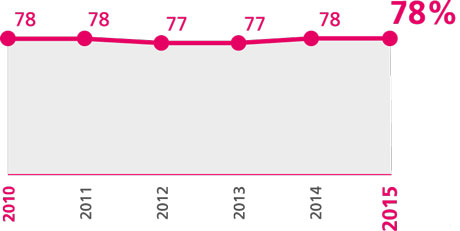
DTP3 coverage in Gavi-supported countries (%)
DTP3 coverage is a standard measure of the strength of immunisation and health systems. This is because the delivery of DTP3 requires three contacts with the health system at appropriate times. Also, DTP vaccine tends to be given through routine national immunisation programmes rather than campaigns.
Data sources
WHO/UNICEF estimates of national immunisation coverage.
First dose of measles vaccine coverage in Gavi-supported countries (%)
Children usually get measles vaccine at nine months of age – later than DTP3 but still within the first year of life. Coverage with the first dose of measles vaccine can, therefore, be used to measure the ability of health services to vaccinate children beyond early infancy.
Data sources
WHO/UNICEF estimates of national immunisation coverage.
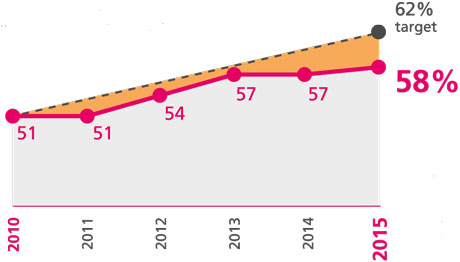
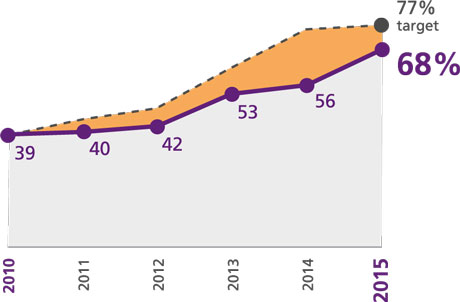
Equity in immunisation coverage (%)
This indicator measured equity in immunisation in Gavi-supported countries by comparing DTP3 coverage for the poorest 20% of the population with that for the richest 20%. It shows the proportion of countries that met the minimum equity benchmark: a difference of less than or equal to 20 percentage points between the two groups.
Data sources
Demographic and health surveys (DHS) and multiple indicator cluster surveys (MICS); other surveys that use comparable methods were used where no DHS or MICS were conducted.
FINANCING GOAL INDICATORS
We relied on three indicators to track our performance against our 2011–2015 financing goal: to increase the predictability of global financing and improve the sustainability of national financing for immunisation.
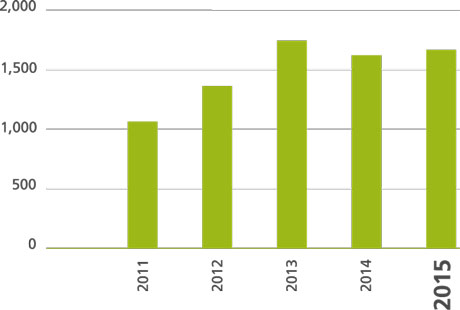
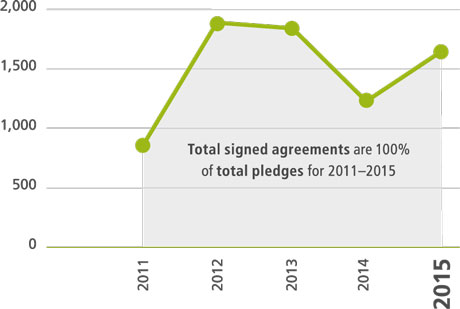
Resource mobilisation targets
These indicators measured the contributions pledged to Gavi and IFFIm, and the percentage of the pledges that had been signed. They tracked our ability to mobilise resources to finance country demand for vaccine support and thus increase the predictability of global financing for immunisation.
Data source
Gavi, the Vaccine Alliance.
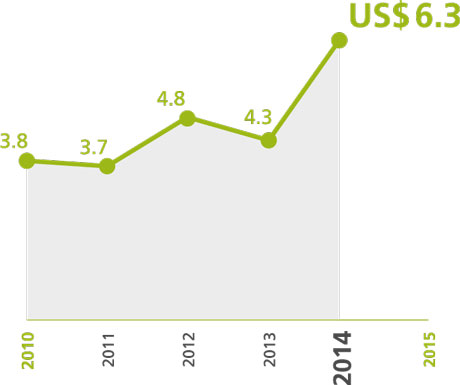
Average investment in vaccines per child in Gavi-supported countries (US$)
This indicator measured the average total amount spent on vaccines per child in Gavi-supported countries. It reflected the priority that governments placed on vaccines as a core public function.
Data sources
WHO/UNICEF Joint Reporting Form; country Annual Progress Reports; Gavi’s Adjusted Demand Forecast; UNPD data.
Timely fulfilment of co-financing commitments (% of countries)
This indicator tracked the proportion of countries that met their co-financing commitments in a timely manner. It was, therefore, a reflection of the sustainability of national financing for immunisation in Gavi-supported countries.
Data sources
UNICEF Supply Division, the PAHO Revolving Fund and invoices from self-procuring countries.
![2011-2015 indicators [French] We achieved or surpassed our three mission goals for the 2011–2015 period Check the indicators below to see how we performed against our mission and strategic goals. For a more detailed analysis of our progress in the period, read the 2015 Annual Progress Report. MISSION INDICATORS In the 2011–2015 period we used three indicators, each with specific targets, to measure progress against our mission: to save children's lives and protect people's health by increasing access to](/sites/default/files/body/2019-11/financing2_460.jpg)
MARKET-SHAPING GOAL INDICATORS
We used two indicators to monitor progress against our 2011–2015 market-shaping strategic goal.
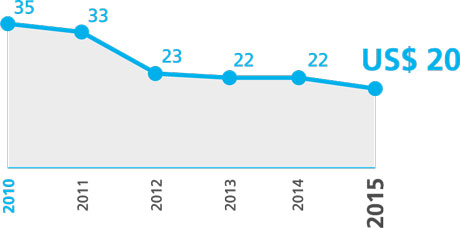
Change in vaccine price
This indicator measured the change in the total cost to immunise a child with a full course of pentavalent, pneumococcal and rotavirus vaccines. Price targets were set but were not published in order to avoid setting a minimum price.
Data source
UNICEF Supply Division.
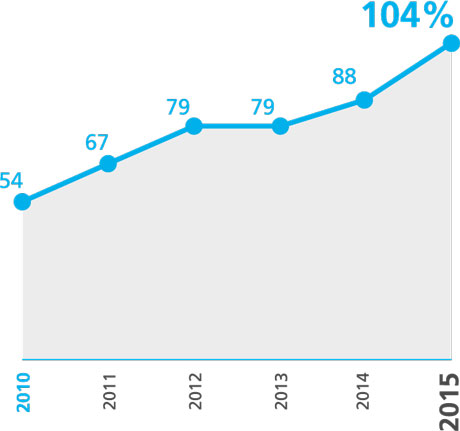
Security of supply: number of products offered as a percentage of five-year target
We used this indicator to measure supply security. It assessed the interest that we generated among existing and new vaccine manufacturers to offer products in response to tenders. The more products offered by different manufacturers, the higher the likelihood of achieving a broad supplier base and healthy competition among manufacturers. Progress was measured against the 2015 target.
